
Glossary·Written by a CPA
P/E ratio
Also called: Price-to-earnings ratio
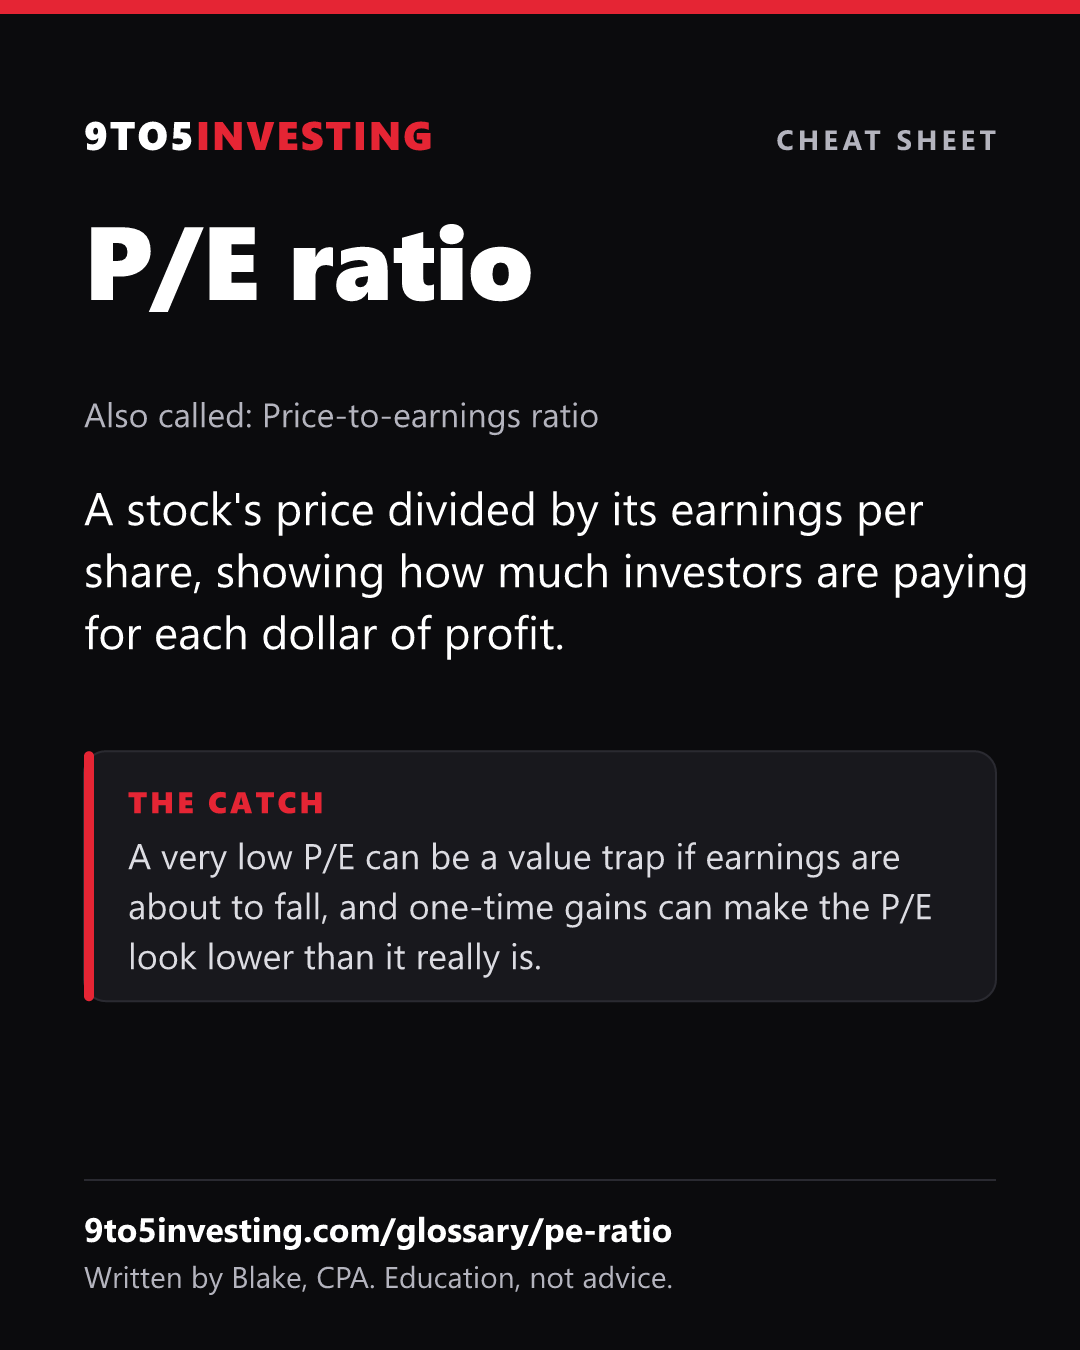
A stock's price divided by its earnings per share, showing how much investors are paying for each dollar of profit.
The P/E ratio is the share price divided by earnings per share, which basically just means how many dollars you're paying for one dollar of the company's yearly profit. When people just say P/E, they usually mean trailing P/E, which uses the last 12 months of earnings.
A higher P/E usually means the market expects more growth, or sees the business as safer, and a lower one usually means lower expectations or more risk. It doesn't on its own tell you whether something is cheap or expensive.
For you, P/E is most useful as a comparison, either to the company's own history or to similar companies. It doesn't work at all for companies that are losing money, since there are no earnings to divide by.
Example. As an example, if a stock costs $60 and the company earned $3 per share over the last year, the P/E is $60 divided by $3, which is 20. You're paying $20 for each $1 of yearly earnings.
The catch. A very low P/E can be a value trap if earnings are about to fall, and one-time gains can make the P/E look lower than it really is.
Where I talk about it
- NVIDIA Stock Analysis (NVDA)- The Best Artificial Intelligence Stock? at 8:55
- Starbucks Stock Analysis (SBUX)- Is Starbucks Stock a Buy in 2020? at 6:16
- Microsoft Stock Analysis (MSFT)- A Buy at ALL TIME Highs (2020)? at 5:51
- Alibaba Stock Analysis (BABA)- The Amazon of the East? at 0:56
- AMD Stock at $520? The $17 Billion Guide Explained at 6:49
- NVIDIA Stock: Why I Wouldn’t Buy All at Once at 4:35
- Anthropic Just Filed for Its IPO—How Big Is the Opportunity? at 10:07
Cheat sheet
Free to save and share. Tap the image to open it full size.
Related terms
This is education, not tax or investment advice. I'm a CPA, but I'm not your CPA. Full disclaimer.